http://www.acsu.buffalo.edu/~dbertuca/maps/cat/map-portion-images.html
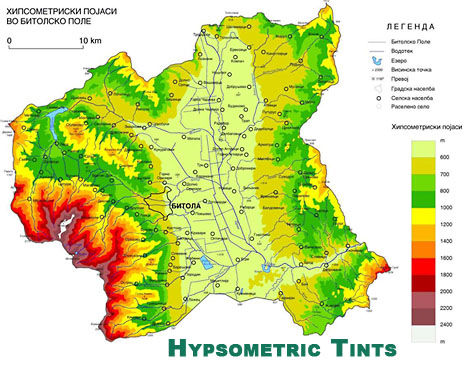
Hypsometric maps or also known as hypsometric tinting use colors to indicate elevation as well as contour lines. They can be used to depict ranges of elevation as bands of color, usually in a graduated pattern or rainbow applied to contour lines themselves. A typical hypsometric map progresses from dark green to lower elevations to yellows and then to white at the highest elevations. Hypsometric maps of land is often accompanied by a similar method of bathymetric tinting to convey the depth of oceans to complete a global hypsometric map. The hypsometric map shown above is not in English, but I can understand it because it has all the features of a hypsometric map where I can understand that the middle of the map is the lowest elevation shown whereas the southwest section of the map is the highest elevation due to the key depicting the graduated color scheme.
No comments:
Post a Comment