(mid-top of source page)
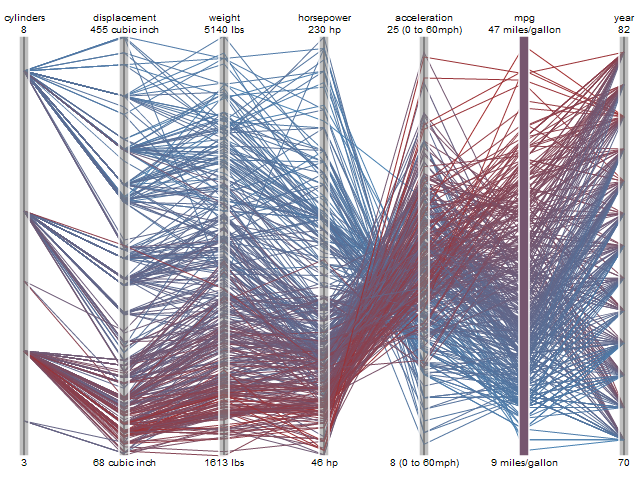
A parallel coordinate graph is a common way of visualizing complex high-dimensional geometry and multivariate data in a much less complex graph. Parallel coordinate graphs are difficult to construct due to the scaling of the axes, the ordering of the variables, and rotation of the axes. Parallel coordinate graphs can easily be inaccurately made as well as inaccurately read which is why it is not popularly used outside of research fields that test products and use parallel coordinate graphs often. Parallel coordinate graphs compare two variables on a set of characteristics with multiple tests. Both variables are usually distinguished with a different color. The image shown above is an example of a parallel graph that compares two vehicles with a large sample size of tests.
No comments:
Post a Comment