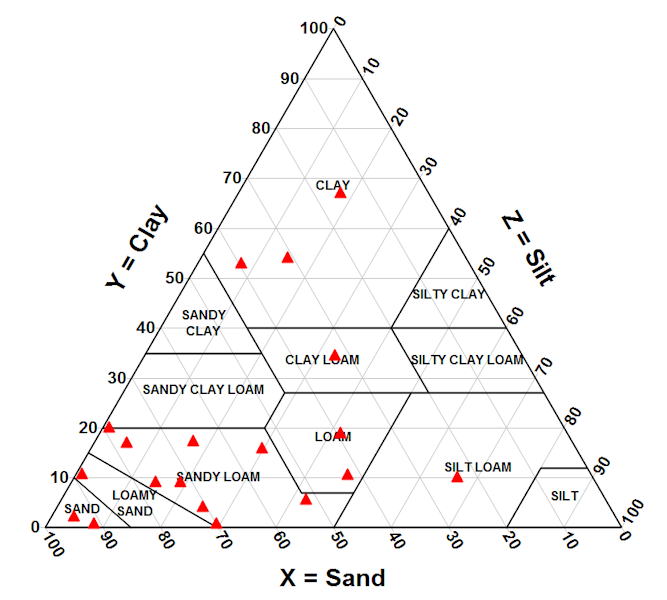
A triangular plot is a barycentric plot where three variables of a certain end product are composed of a percent of each of the three variables. Triangular plots are read from the X variable up, the Y variable corner to the right and the Z variable from the right corner to the left side. The end product is a 100% composition added together from the three variables. Triangular plots ignore quartnery and other extraneous variables that were negligible so that the triangular plot can remain easily read. The image shown above is an example of a triangular plot where types of soil can be named determined by the amount of the soil that is composed of clay, silt and sand.
No comments:
Post a Comment