A dot distribution map is a map type that uses the dot symbol to depict phenomena across space. The location of the dots can depict spatial patterns when grouped together. A dot distribution map can shown the spread of disease as well as what language is spoken in an area. An advantage of dot distribution maps is that it can easily depict ideas by removing irrelevant detail. A disadvantage of dot distribution maps is that the dot size and spacing can inaccurately depict information depending on how well the map is made. The dot distribution map shown above depicts the advantage and disadvantage of their use. The map easily shows global populations, but also makes it difficult to depict the amount of dots that are shown because the most populated land areas turn the dots almost turn into a type of shading.
Monday, July 28, 2014
Propaganda Map
Hypsometric Map
(bottom of page)
http://www.acsu.buffalo.edu/~dbertuca/maps/cat/map-portion-images.html
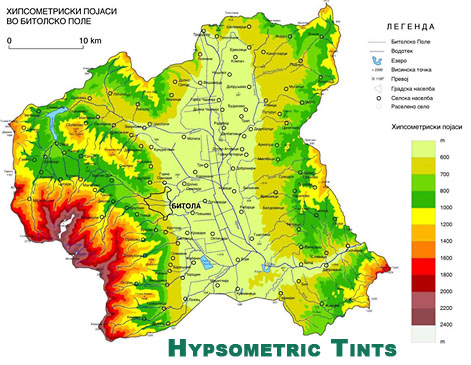
Hypsometric maps or also known as hypsometric tinting use colors to indicate elevation as well as contour lines. They can be used to depict ranges of elevation as bands of color, usually in a graduated pattern or rainbow applied to contour lines themselves. A typical hypsometric map progresses from dark green to lower elevations to yellows and then to white at the highest elevations. Hypsometric maps of land is often accompanied by a similar method of bathymetric tinting to convey the depth of oceans to complete a global hypsometric map. The hypsometric map shown above is not in English, but I can understand it because it has all the features of a hypsometric map where I can understand that the middle of the map is the lowest elevation shown whereas the southwest section of the map is the highest elevation due to the key depicting the graduated color scheme.
http://www.acsu.buffalo.edu/~dbertuca/maps/cat/map-portion-images.html
Hypsometric maps or also known as hypsometric tinting use colors to indicate elevation as well as contour lines. They can be used to depict ranges of elevation as bands of color, usually in a graduated pattern or rainbow applied to contour lines themselves. A typical hypsometric map progresses from dark green to lower elevations to yellows and then to white at the highest elevations. Hypsometric maps of land is often accompanied by a similar method of bathymetric tinting to convey the depth of oceans to complete a global hypsometric map. The hypsometric map shown above is not in English, but I can understand it because it has all the features of a hypsometric map where I can understand that the middle of the map is the lowest elevation shown whereas the southwest section of the map is the highest elevation due to the key depicting the graduated color scheme.
Public Land Survey System Map
(mid-bottom of page)
A Public Land Survey System map is a map that shows the subdivision and description of land in the United States after the Revolutionary War in the western part of present day United States of America. All lands in the public domain are altered to fit within this rectangular system of surveys. The Public Land Survey System is a rectangular survey system that divides the land into 6-mile square townships which are further subdivided into 1-mile square sections. This system graphs land so that you can find land easily when each section has their own unique identification. The Public Land Survey System map used above shows the rectangular system in action representing Franklin County in Alabama.
Sunday, July 27, 2014
Cadastral Map
(click View Sample Image)
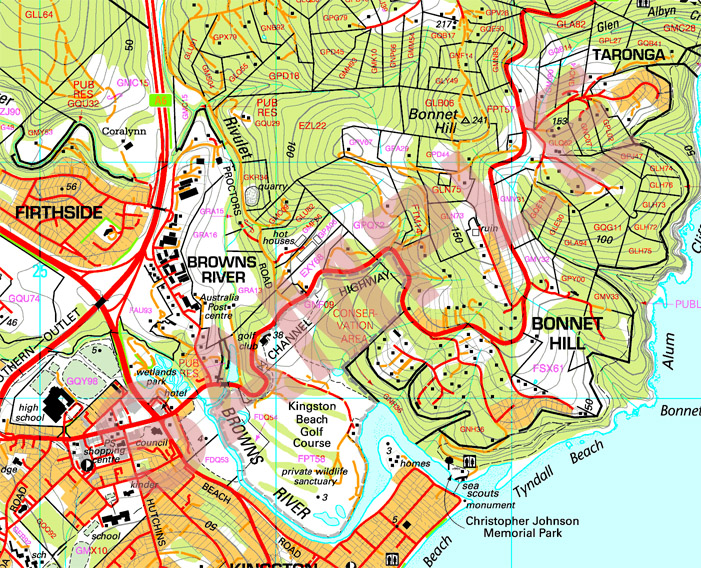
A cadastral map, is a comprehensive view of the metes-and-bounds system used on an area of land. A cadastral map shows details of the ownership, the tenure, the precise location, dimensions and the value of individual parcels of land. Most countries use cadastral maps for administrative and legal purposes to define as best as possible the dimensions and location of land parcels which are very useful to settle law suits and land disputes between neighboring land owners. The image above is that of a cadastral map in Australia that depicts parcels of land available for sale sectioned off into what I believe to be in polygonal sections that are measured in acres of land.
Thematic Map
(top-middle of page)
http://udel.edu/~csiwinsk/frec480/proj1/
A thematic map is a type of map or chart especially designed
to show a particular theme connected with a specific geographic area. These
maps inter-relate aspects of land use with complicated issues concerning politics, culture, and the
physical environment. A thematic map is able to tell a story of what is occurring
in an area in relation to human activity. The image above is a thematic map that tells a story of poverty within America where poverty is shown to occur in the southern and northwestern parts of the United States.
Topographic Map
(top left)
http://geomart.com/products/topo/generaltopo.htm
A topographic map is a map type known for large-scale detail
and representation of relief usually with contour lines. A topographic map is traditionally
known with representing natural and man-made features. A topographic map is
typically made in a series of prints so that when put together a larger map can
be constructed. The image used as an example above is a section of the United
States Geological Survey, particularly of the Cooper Rocks State Forest.
Subscribe to:
Posts (Atom)