Monday, July 28, 2014

Continuously Variable Proportional Circle Map


A continuously variable proportional circle map shows proportional circles that come in a wide distribution of sizes that are not limited to classes. There are no set amount of classes in a map key that limit the size of the proportional circle hence the map being called a "continuously variable proportional circle". Continuously variable proportional circle maps can express all data in the map more accurately for each individual area than averaging it out to a set number of proportional circles. The image shown above is of a continuously variable proportional circle map that shows the proportion of different types of meat that were sent to Paris butcheries from different regions in France.

Digital Orthophoto Quarter Quadrangle


The Digital Orthophoto quarter Quadrangle or (D.O.Q.Q.) covers a quarter of the Digital Orthophoto Quadrangle which is aerial photography or satellite imagery that has been edited so that its pixels are aligned with longitude and latitude lines for organizational purposes and have a narrowly defined region of coverage. The Digital Orthophoto quarter Quadrangle is a widely used format introduced by the United States Geological Survey. D.O.Q.s produced by the U.S.G.S. cover an area measuring 7.5-minutes longitude by 7.5-minutes latitude. Digital Orthophoto Quarter Quadrangle covers one quarter of a quadrangle which shows more detail than the standard D.O.Q. The image above is from 2005 of  the Digital Orthophoto quarter Quadrangle from Cole County, Illinois.

Digital Elevation Model


A digital elevation model or D.E.M. is a three dimensional representation of a terrain's surface which can include non-terrestrial surfaces like the moon. D.E.M. data is mostly received from satellites. Multiple satellites coordinate and perform stereo and tri-stereo operations for accurate elevation readings. Stereo satellite operations use two satellites to create D.E.M.s when there is no large change in elevation heights whereas tri-stereo operations use three satellites that can accurately show data between areas where there is a large change in elevation height. Private companies as well as governmental satellites can provide this type of imaging which vary in image quality and resolution. The image shown above is a digital elevation model of a small part of Indiana where you can distinguish the ridge lines that could form a river from the rest of the landscape which is at a higher elevation. 

Digital Line Graph


A D.L.G. or digital line graph is a cartographic map feature represented in digital vector form that was created by the United States Geological Survey. D.L.G.s are collected from U.S.G.S. maps and are distributed in large, intermediate and small-scale with different categories of features depending on the scale. The D.L.G. features national park boundaries, public land section lines, hydrographic features, topographic contour lines, Roads, trails, and railroads. D.L.G.s are a soft copy overlay which allowed features to be optional and modified to what the user requires. The image above is a D.L.G. on a U.S.G.S. map section where you can individually distinguish roads, hydrographic features as well as topographic contour lines.


Digital Raster Graphic


Digital Raster Graphics or (D.R.G.s) are scanned, digitized and georeferenced United States Geologic Survey topographic maps. They can be found in three scales that are available from 1:24,000 to 1:100,00 and 1:250,000 scales. The datum of the source materials is preserved in the D.R.G. The U.S.G.S. uses up to 13 colors on each D.R.G. map and has high quality versions available. U.S.G.S. D.R.G. maps as well as other map types of the U.S.G.S. are widely available online as well as hard copy versions are available if you look for them at a local university or book store. The image above is a D.R.G. of a section of the U.S.G.S. in Yosemite National Park. Landmarks are shown on the D.R.G. as well as elevation lines that would be helpful for anyone temporarily camping and hiking in Yosemite National Park.

Isopleth Map


http://geographyfieldwork.com/DataPresentationMappingTechniques.htm

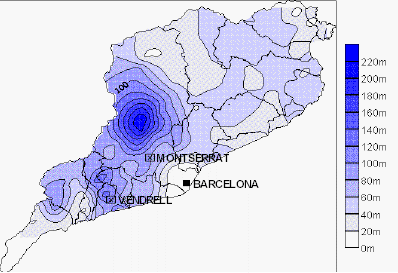
An isopleth map generalizes and simplifies data with a continuous distribution. Isopleth maps show the data as a third dimension on a map, thus isopleth maps are an umbrella term for mapping surface elevations, amounts of precipitation and atmospheric pressure readings. The third dimension is shown by a series of lines called isopleths which connect points of equal value. Isopleths never cross or divide and always form enclosed circles inside the map. The image shown above is that of the concentration of precipitation in Italy 10th of June 2000.

Isopach Map


http://www.geo.utexas.edu/faculty/barker/kempter/rbtephra.html

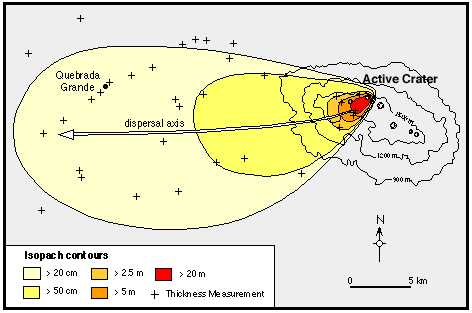
An isopach map illustrates thickness variations within rock layers or stratum. Isopachs are contour lines that represent equal thickness over an area. Isopach maps are utilized in hydrographic survey, stratigraphy, sedimentology, structural geology, petroleum geology and volcanology. Isopach maps can help protect lives as well as save money when used in certain geologic fields. The image shown above shows the value of having an isopach map. This isopach map shows the dispersal of ash that could be potentially harmful to those living nearby the estimated area.